It’s the second week of school. Rob Cushman’s non-honors, non-AP biology students have done a little reading and talking about scientific inquiry. They have sampled different genres of science text. They have tried out a couple of partner Think Alouds. Rob has introduced a “metacognitive bookmark,” a reminder of some thinking processes they can use when they read.
On this day, Rob asks students to read in the textbook and keep a two-column metacognitive reading log: “I Saw/I Thought.” Students recognize that this Reading Apprenticeship stuff is unfamiliar territory—weird, even—for learning science. Not too far into the lesson, students challenge their teacher: “Mr. Cushman, How do we know this is working?”
Metacognitive Bookmark
Predicting
- I predict…
- In the next part I think…
- I think this is…
Validating
- I picture…
- I can see…
Questioning
- A question I have is…
- I wonder about…
- Could this mean…
Making connections
- This is like…
- This reminds me of…
Identifying a problem
- I get confused when…
- I’m not sure of…
- I didn’t expect…
Using fix-ups
- I’ll reread this part…
- I’ll read on and check back…
Summarizing
- The big idea is…
- I think the point is…
- So what it’s saying is…
Rob swallows, remembers he’s a science teacher, and says, “How can we find out?”
A student remembers last week’s work about science inquiry. “Data,” she offers.
Rob counters, “What data do we have?”
“Reading logs?”
“What data can we get from our reading logs that will help us answer our question?”
And so Rob asks students to collect themselves into small groups of three or four and come up with some possible answers to the central question: How can we find out?
When Rob calls the class back together, students demonstrate that they have taken up their inquiry as scientists.
“We can use those bookmark categories, like for predicting or making connections.” “Frequency, how often we use them.” “Control.”
“What do you mean, control,” Rob asks.
“Reading a newspaper article is different than reading the textbook or a research article, right? We should just read one kind.”
“Lots of data, so it’s not just a chance thing.”
“How are we going to collect this data,” Rob asks.
“Can we make a graph?”
Rob gets students thinking about what their graph would look like and what data they would need.
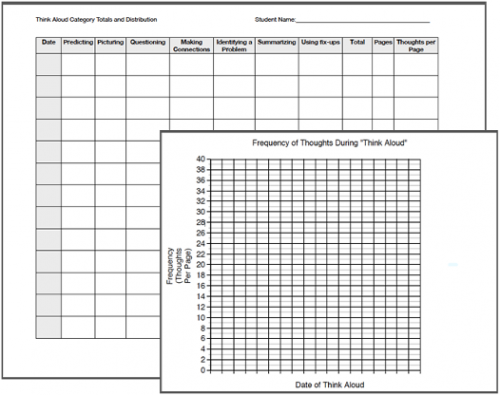
During two, at first, and then one reading assignment a week, students individually record on a data table each time they catch themselves using a particular thinking process from the bookmark. Also, on individual graphs, students plot the frequency of all their “thoughts”—averaged per page—over time.

Students’ inquiry enters a new stage when they notice that their use of strategies is taking a dip. “Are we failing at this,” students worry, but then conclude they must be having fewer “thoughts” because their thoughts are becoming more thoughtful! It takes longer.
Rob asks students to predict what’s going to happen next with their thinking. Students sense that like hitting a baseball, they are going to get the swing of it. They do, and their frequency graphs take off. “Exponentially,” Rob grins.
Rob enjoys one last piece to this story. After a while, students notice that their graphs have leveled off. “Why,” they ask, and then realize that the thinking processes they worked long and hard to make visible are becoming so commonplace that they do not always notice them.
Rob Cushman teaches science at Wyomissing Area Junior Senior High School, in Wyomissing, PA.

